Analyzing the S&P 500 index, NASDAQ and the Russell 2000 charts The U.S. stock market benchmark indexes have declined since peaking in the summer months of July and August 2023. Interest rate hikes
By Jea Yu •
This story originally appeared on MarketBeat
The U.S. stock market benchmark indexes have declined since peaking in the summer months of July and August 2023. Interest rate hikes are slowing down as inflation cools off. Consensus is growing regarding whether the economy may avert a recession as the potential for a soft landing rises.
Despite the inverted yield curve and a strong job market, bears argue we are edging closer to a 1987-like market crash. Sentiment changes daily. The breadth of the market continues to be weak on bounces. We'll take a technical analysis-based look at how the major indexes are faring in 2023. We will use exchange-traded funds (ETFs) for each index.
SPDR S&P 500 ETF Trust (NYSEARCA: SPY)
The S&P 500 index is the most widely followed benchmark index to gauge the overall market performance. Unfortunately, as a market cap-weighted index, most of its gains can be impacted by the highest market-cap companies. The Magnificent Seven club comprises Meta Platforms Inc. (NASDAQ: META), Apple Inc. (NASDAQ: AAPL), Alphabet Inc. (NASDAQ: GOOGL), Nvidia Co. (NASDAQ: NVDA), Amacon.com Inc. (NASDAQ: AMZN), Microsoft Co. (NASDAQ: MSFT) and Tesla Inc. (NASDAQ: TSLA) comprises nearly 30% of the market cap of the S&P 500.
At its high, the SPY was up 15% in July 2023. It has returned nearly half the gains with a 7.8% year-to-date (YTD) performance. The SPY fell 2.5% in the past week, causing it to fall into correction territory again as it pulled back more than 10% from its highs.
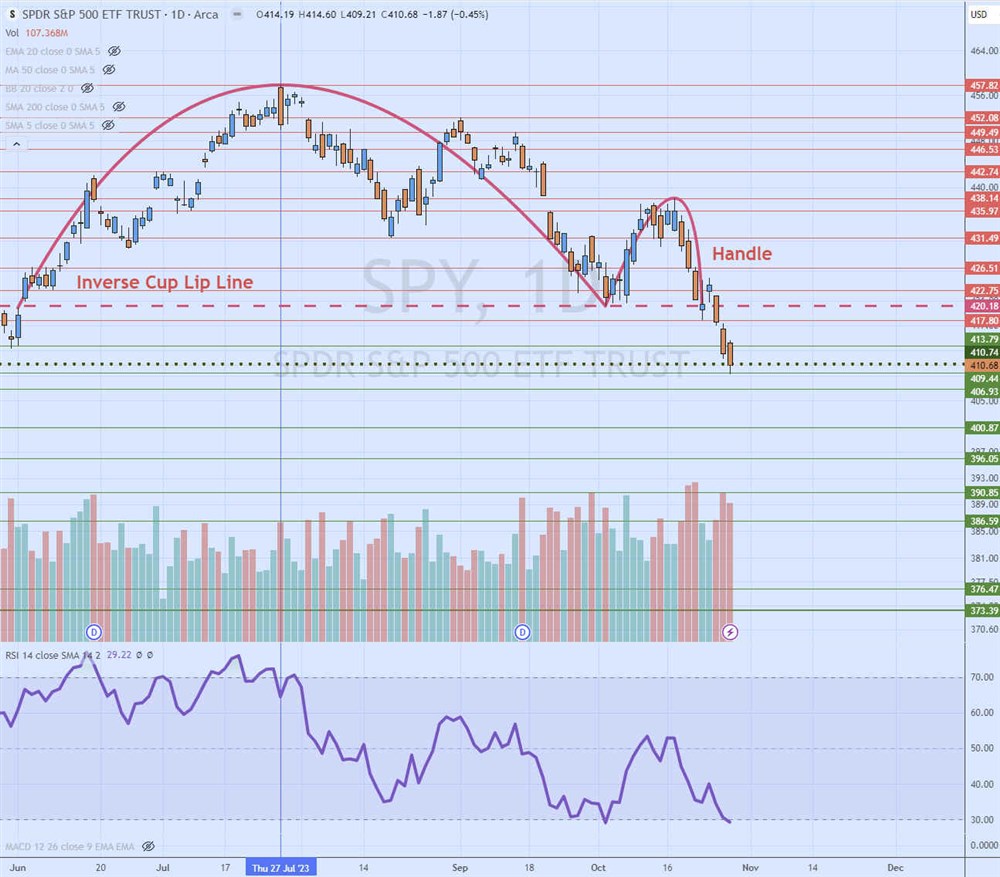
Daily Inverse Cup and Handle Breakdown
The daily candlestick chart on SPY illustrates an inverse cup and handle breakdown. The cup lip lines commenced on June 1, 2023, at $420.18. SPY rose to a peak of $457.82 on July 27, 2023, as it turned back down. The SPY fell to bounced off the inverse cup lip line on Oct. 3, 2023, to a high of $435.14. The handle formed as shares fell back down to retest and break the inverse cup lip line, which also overlaps with the daily 200-period moving average at $420.18. The daily market structure low (MSL) trigger support is $410.74. The daily relative strength index (RSI) has again slipped to the oversold 30-band. The key pullback support areas are $400.87, $390.85, $386.59 and $379.39, which is the cup and handle downside extended target.
Invesco QQQ (NASDAQ: QQQ)
The Nasdaq 100 index can be tracked with the QQQ ETF. The Nasdaq 100 is a modified market-cap weighted index that performed a rebalancing on July 24, 2023.
The QQQ is the strongest-performing U.S. benchmark index, reaching a performance high of 38.7% in July 2023. Its gains have been trimmed down to 30.6% YTD. The Magnificent Seven stocks accounted for just over 55% of the Nasdaq 100 before rebalancing on July 24, 2023. Due to the adjustments, the Magnificent Seven group has an adjusted weighting of nearly 43%, which is a higher weighting than the S&P 500 index.
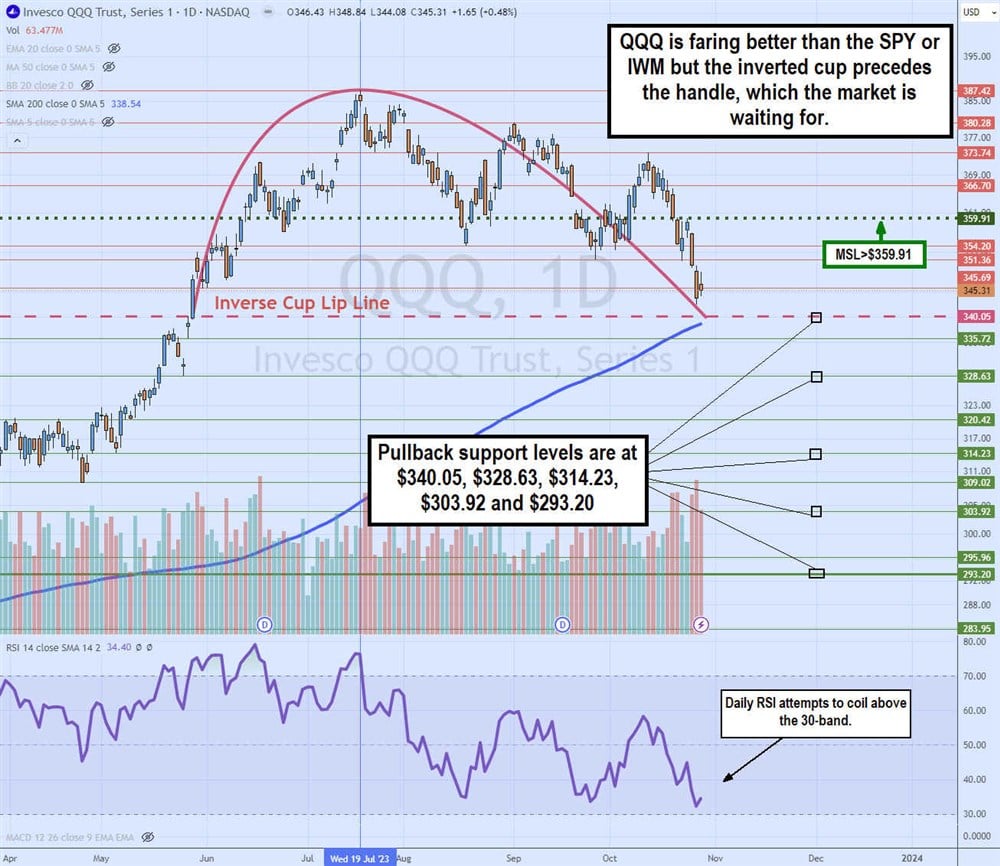
Daily inverse cup
The daily candlestick chart on the QQQ is similar to the SPY, but it hasn't tested the daily 200-period moving average at $338.54 yet. The inverse cup lip line is at $340.05. The daily MSL trigger is up at $359.91. Completing the daily inverse cup may cause a breakdown or a rebound off the lip line to form a handle. If the handle forms on a bounce and plunges back down through the lip line, the inverse cup and handle would form with a target near $293.20. Key pullback support levels are $340.05, $328.63, $314.23, $303.92 and $293.20.
iShares Russell 2000 ETF (NYSEARCA: IWM)
The Russell 2000 is a small-cap benchmark index. Small-caps are riskier and more volatile than large-cap stocks. While the Russell 2000 is a market-cap-weighted index like the SPY, having 2,000 stocks helps to prevent a small handful of stocks from overly impacting the index. At the high, IWM was 11.4% in July 2023. Currently, the IWM is down 6.45% YTD. However, it was trading down 33.6% from its high of $244.46 in November 2021. The bear market trigger price is $195.56, which equates to a 20% pullback from its highs. IWM fell under there on Aug. 4, 2023. The two-month minimum under the 20% pullback period cuts off on Oct. 4, 2023. The IWM has been in a bear market since Oct. 4, 2023.
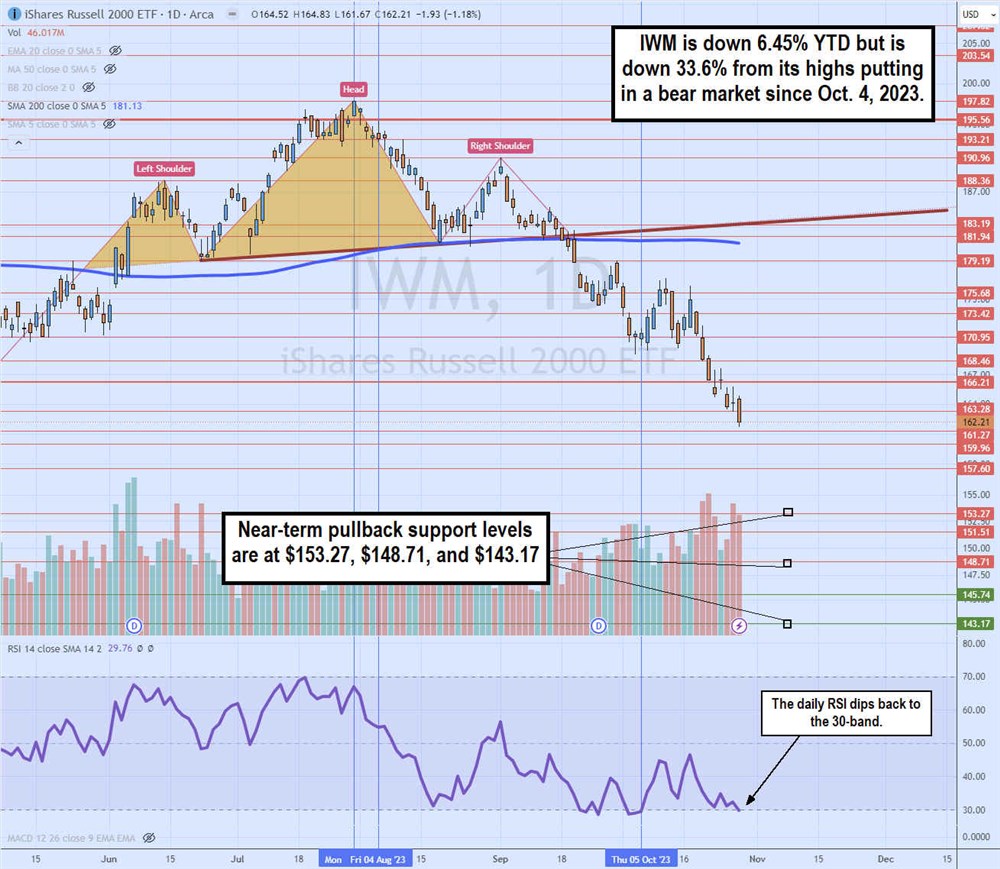
Daily head and shoulders breakdown
The daily candlestick chart on IWM illustrates the extensive collapse from the head and shoulders breakdown collapsing through the 200-period MA near $182. IWM has been in bear market territory since peaking and falling under $195.96 on Aug. 4, 2023, at the 20% pullback level from its highs. IWM is now down 33.6%, firmly in bear market territory, having fallen under the $166.21 November 2020 gap-fill support level. The daily RSI has slipped back down to test the 30-band again. Near-term pullback support levels are $153.27, $148.71 and $143.17.


