3 Charts that PROVE Future Direction of Stock Market
If a picture is worth a thousand words, then get ready for 3 charts and 3,000+ words that point to the future direction of the stock market (SPY). Spoiler Alert:…

This story originally appeared on StockNews
If a picture is worth a thousand words, then get ready for 3 charts and 3,000+ words that point to the future direction of the stock market (SPY). Spoiler Alert: Better buy the dip now while the low prices last. Get the rest of the story below.
(Please enjoy this updated version of my weekly commentary from the Reitmeister Total Return newsletter).
Sometimes the market advances because of new positive catalysts emerging.
And sometimes we advance because the previously believed negative catalysts are shown to be nothing more than toothless monsters. This allows stocks to rise as the previously feared obstacles disappear in the rear view mirror.
Obviously I am saying the latter scenario is at play right now which is why stocks are now 300 points above the recent lows…and soon enough will climb another 300 points to take on the previous highs…and by the end of the year will easily ascend another 300 points or more to new record highs.
The reasons why will be spelled out a bit more in the commentary below.
Market Commentary
On Monday afternoon we had a well-attended POWR Platinum webinar. The main event was an updated stock market outlook which covered why stocks tumbled in January and why they are on the march higher once again. (See webinar here).
But as long as you are here, I am happy to share the main points of the presentation. That starts with a technical chart of the S&P going back the past year.
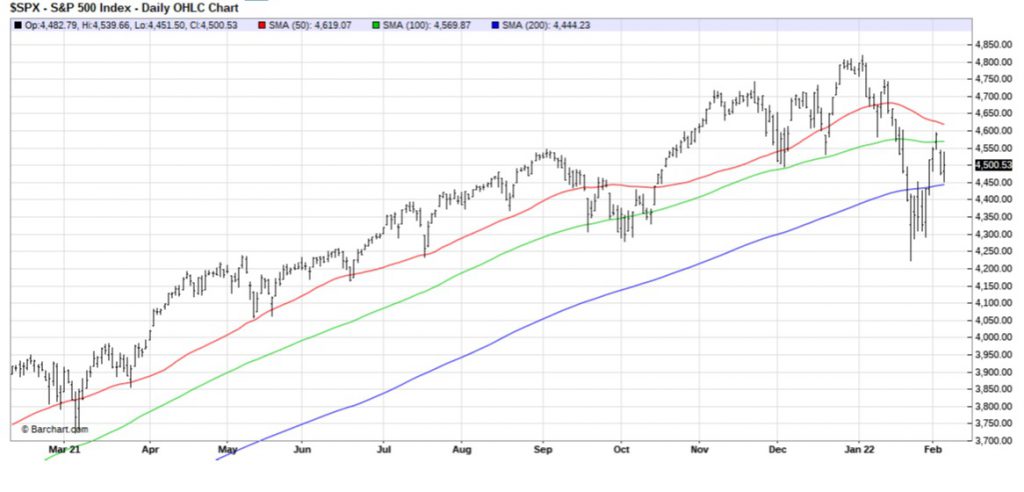
The red line is the 50 day moving average which has been tested again and again the past year. Less so is the green line showing the 100 day moving average. But as you can see the blue, long term trend line of the 200 moving average was recently breached for the first time in this year…and truly the first time since June 2020.
(2/9/22 Update: As is typical the market had to retest the 200 day moving average after it initially broke above. That support came in strong given market action Monday and Tuesday thus this break out lower has been rejected with stocks ready to continue their move higher.)
Now the question is: Why was now the time to finally have this technical test of bullish resolve?
Take your pick of…
- Omicron
- Inflation
- Fed Raising Rates
- Russia & Ukraine
Each of these was not strong enough on their own to cause the 10% correction. But the combination of them all at once was as good a reason as any for the market to pause and wring out excesses.
Pause is a good word…like the oft used stock traders expression “the pause that refreshes”.
And that appears to be exactly what is happening because all other signals are bullish. That starts with the 3 E’s of investing:
- Economy
- Employment
- Earnings
Each of them is looking quite healthy even with all these supposed negatives in the air making it easier to ignore them and get back in a buying mood.
But even more than that is a reminder that stocks are still MUCH MORE attractive investments than bonds. That is best explained with these next 2 charts.
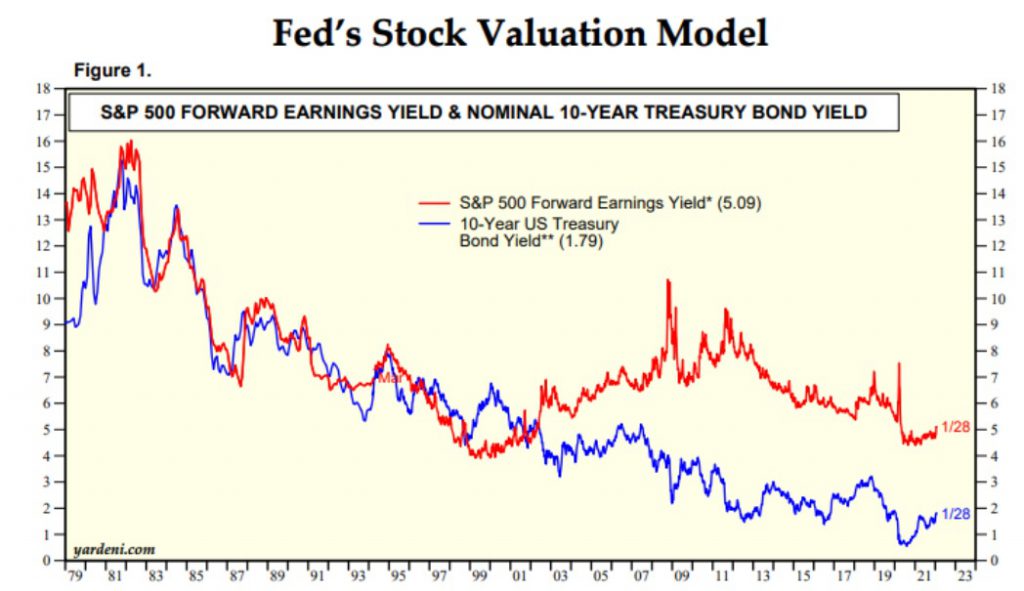
Above is the relationship between bonds and the stock market as best expressed through their relative yields. The blue line is the 10 year Treasury yield which has been at historic lows the past few years. The red line is the Earnings Yield of the stock market.
Note that for the majority of time they have been in parity. Meaning if bonds offered a better yield than stocks, then more money would flow in that direction til rates became equivalent. However, for the better part of the past 20 years rates have been so low, that it makes stocks look that much more attractive.
Yes, this is the #1 ingredient behind the longest bull market in history (2009 to 2020)…and in many ways continues to this day minus those crazy couple months with the Coronavirus Bear Market.
Some folks don’t quite get it with the above chart. So let me offer you one more to tell the story.
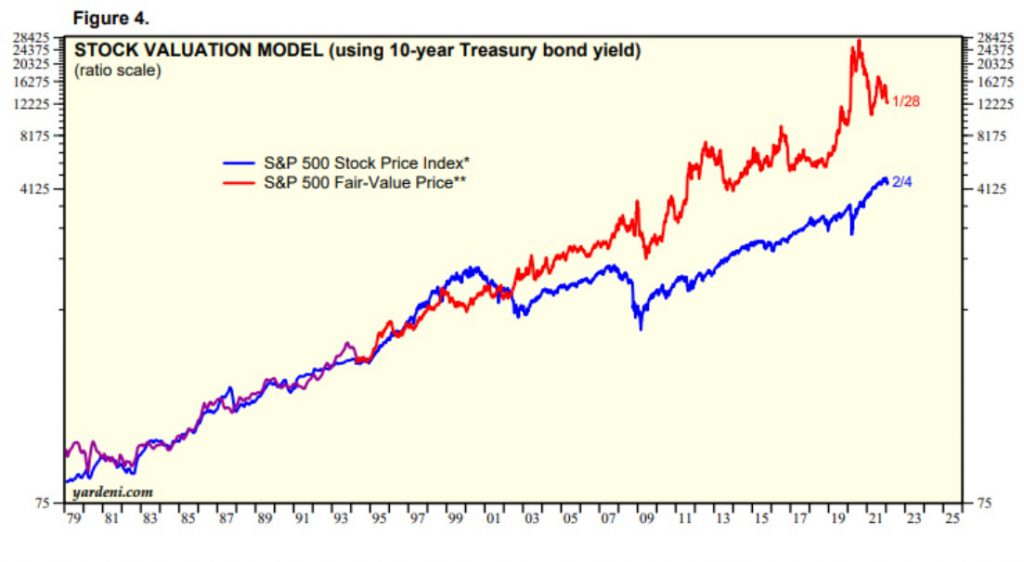
This chart basically shows what the S&P 500 would be valued at if it traded for the same yield as 10 year Treasuries. Your eyes do not deceive you. It is saying the stock market would be more than 2.5X higher than it is now.
No…I don’t think that will happen any time soon. However, I do strongly believe that rates will get back to normal 3.5% to 4% levels at which point it will come into parity with the stock market.
This means it’s a bull market until the above happens OR if there is a recession. All other negative catalysts are not strong enough to undue the upside potential of the market.
Sure there will be a pullback or correction here or there. But it is absolutely still a bull market for the foreseeable future. So if you haven’t bought the dip yet…then do so now before the opportunity evaporates.
We certainly got the memo with the Reitmeister Total Return and are enjoying strong outperformance on the year. Heck, today alone we doubled the market and some of the recent red arrows in the portfolio have flipped back to green.
What To Do Next?
Discover my top picks for this hectic market environment.
I am referring to the 12 stocks and 2 ETFs in my Reitmeister Total Return portfolio that firmly beat the market last year. And continues to outperform by a wide margin in 2022.
In fact, the 2 ETF trades are plays on the rising interest rate environment and dramatically outperforming the market of late. (Because the Fed is firmly on a rising rate path).
All of these selections are based upon my 40 years of investing experience. Plus we rely heavily on the benefits of the POWR Ratings model with it’s impressive +31.10% annual returns since 1999.
All you have to do to see my current recommendations is to…
Wishing you a world of investment success!

Steve Reitmeister…but everyone calls me Reity (pronounced “Righty”)
CEO, Stock News Network and Editor, Reitmeister Total Return
SPY shares were trading at $455.98 per share on Wednesday morning, up $5.04 (+1.12%). Year-to-date, SPY has declined -4.00%, versus a % rise in the benchmark S&P 500 index during the same period.
About the Author: Steve Reitmeister

Steve is better known to the StockNews audience as “Reity”. Not only is he the CEO of the firm, but he also shares his 40 years of investment experience in the Reitmeister Total Return portfolio. Learn more about Reity’s background, along with links to his most recent articles and stock picks.
The post 3 Charts that PROVE Future Direction of Stock Market appeared first on StockNews.com
If a picture is worth a thousand words, then get ready for 3 charts and 3,000+ words that point to the future direction of the stock market (SPY). Spoiler Alert: Better buy the dip now while the low prices last. Get the rest of the story below.
(Please enjoy this updated version of my weekly commentary from the Reitmeister Total Return newsletter).
Sometimes the market advances because of new positive catalysts emerging.


