Where Job Growth Is Strongest (Infographic)
Opinions expressed by Entrepreneur contributors are their own.
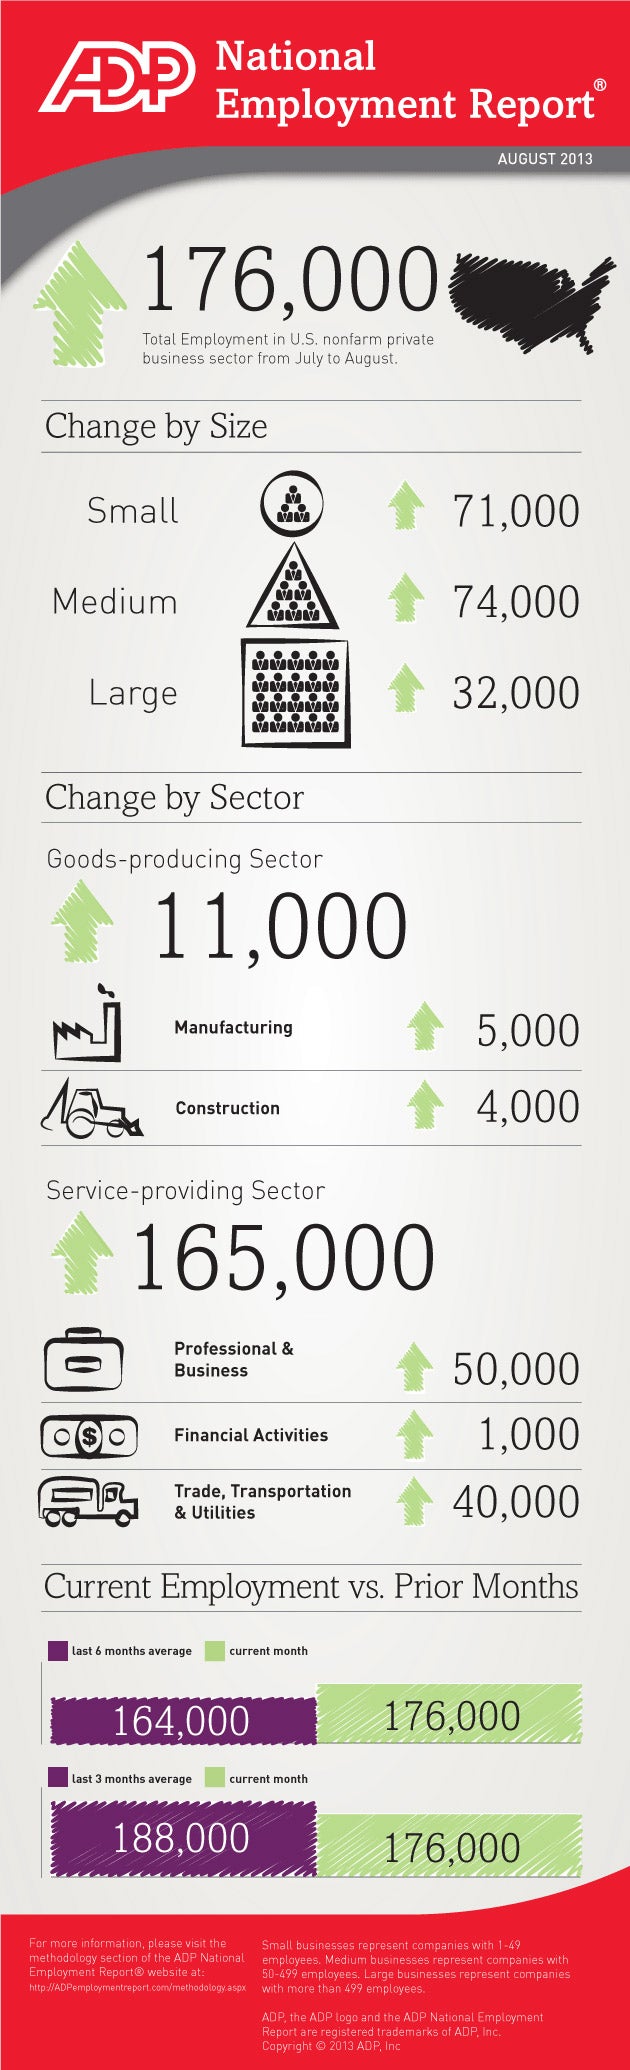
While 176,000 jobs were added in August, according to the ADP National Employment Report, take that number with a grain of salt. It isn’t necessarily good news for the economy. The number rests slightly above the six-month average of 164,000, but below the three-month average of 188,000, revealing that growth has slowed.
For a look at the numbers broken out by sector and business size, take a look at the infographic from ADP below.
Click to Enlarge+


