3 Stocks Near Breakout Pivot Points
Labcorp (NYSE: LH), Gildan Activewear (NYSE: GIL) and B. Riley Financial (NASDAQ: RILY) are all near pivot points following corrections prior run-ups….

Depositphotos.com contributor/Depositphotos.com via MarketBeat
This story originally appeared on MarketBeat
Labcorp (NYSE: LH), Gildan Activewear (NYSE: GIL) and B. Riley Financial (NASDAQ: RILY) are all near pivot points following corrections prior run-ups.
B. Riley Financial,
The pivot point, or buy point, is the area of a consolidation where a stock’s price surpasses previous resistance. For example, in a cup-shaped pattern, the pivot corresponds to the high point on the left side. In a cup-with-handle base, the buy point is the high of the handle.
When the price moves higher than this prior resistance, ideally in heavy volume, it’s a signal that it could be setting up for even bigger gains in the not-so-distant future.
While it’s certainly possible to feel some FOMO as you wait for a higher price before getting into a stock, it may help to frame that action as buying a cheap insurance policy. By waiting, you’re increasing the likelihood that you’re buying into a rally, rather than the continuation of a correction.
Labcorp, which provides clinical testing services at a network of 49 locations, cleared the mid-point of a double-bottom base that began after the stock retreated from a May 10 high of $280.69.
The first leg down of the base bottomed out at $262.08 before the stock rallied and hit resistance at $277.50. It then fell again, reaching a low of $256.81 before attempting its next uptrend.
A proper double-bottom base features a second-leg down that undercuts the first. That serves to shake out the last remaining weak holders, or those who haven’t yet taken profits after a big run-up. In turn, it makes the stock more attractive for new buyers looking to enter at a lower price.
This new base occurred after a prior run-up of 36.86% year-to-date and 61.41% in the past year.
Trading volume was below average as the stock cleared its double-bottom buy point of $277.50, although turnover was heavier than in Friday’s pre-holiday session. Look for the stock to continue rallying in the next few sessions, ideally in heavier volume, to confirm the breakout. 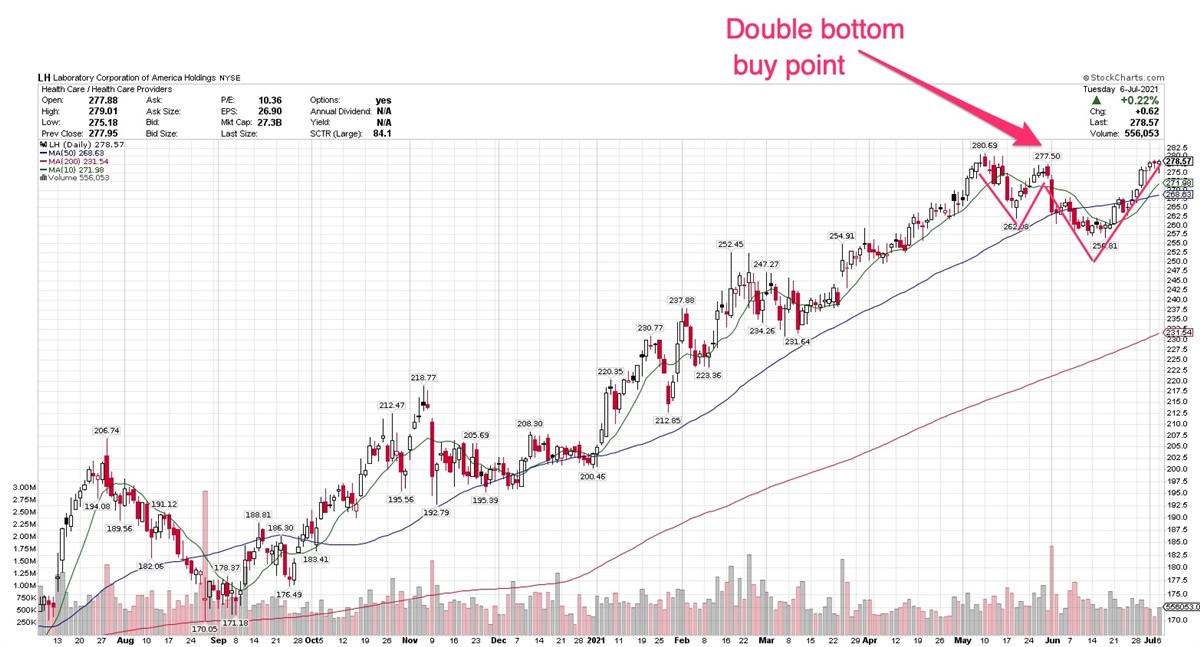
If you own printed T-shirts that you’ve either bought or been given as part of a company or event’s “swag” giveaways, you probably own some Gildan products.
After slowing earnings growth in 2019 and a loss in 2020 (while all those swag-heavy events were canceled), both revenue and earnings resumed growth in the past two quarters.
The stock rallied 28.22% year-to-date and 128.03% in the past 12 months. On May 6, it rallied to a two-year high of $38.14 before pulling into a flat base that corrected 11% over the next seven weeks.
In Friday’s session, Gildan shares rallied to an intraday high of $38.50, but finished at $37.51. Trading volume was light, which was probably due to July 2 being the day before a long holiday weekend. Nonetheless, high turnover is a hallmark of successful rallies, and you’d like to see that.
The stock fell 4.67% Friday, to $35.76, finding support at its 50-day line. Trading volume was 12% above average. It’s possible the breakout has failed, and the stock will form a new base. This stock has potential, but is not one to buy until a new breakout is confirmed.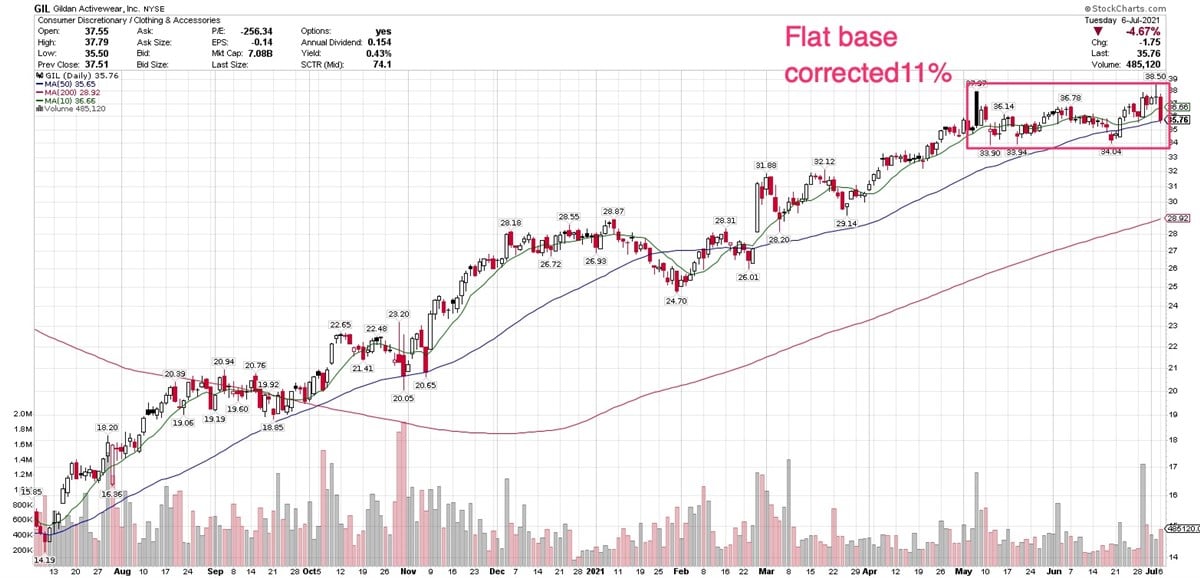
The stock rallied 87.90% year-to-date and 280.63% in the past year. After that kind of rally, you’d expect to see profit-taking, which is exactly what occurred.
It formed a cup-shaped base below $78.95, declining to $65.14 on June 14 before beginning to etch the right side of the base. It hit resistance between $77 and $78 on July 1 and July 2, and failed to garner any upside momentum on July 5, despite finishing $0.14 higher, at $76.59.
The stock may yet resume its rally and pass the $78.95 buy point, or it may form a handle with a different buy point with a lower entry option. With the company’s strong revenue and earnings growth recently, it appears to have potential to rally again soon, if the broader market cooperates. 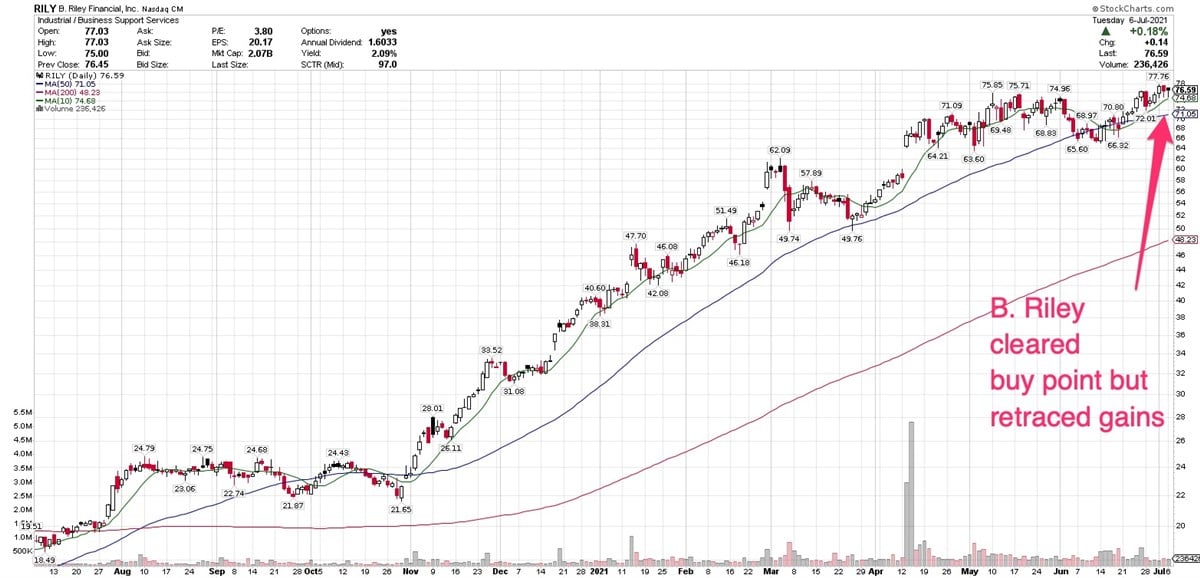
Featured Article: What does it mean to hold a stock in street name?
Labcorp (NYSE: LH), Gildan Activewear (NYSE: GIL) and B. Riley Financial (NASDAQ: RILY) are all near pivot points following corrections prior run-ups.
The pivot point, or buy point, is the area of a consolidation where a stock’s price surpasses previous resistance. For example, in a cup-shaped pattern, the pivot corresponds to the high point on the left side. In a cup-with-handle base, the buy point is the high of the handle.
When the price moves higher than this prior resistance, ideally in heavy volume, it’s a signal that it could be setting up for even bigger gains in the not-so-distant future.
While it’s certainly possible to feel some FOMO as you wait for a higher price before getting into a stock, it may help to frame that action as buying a cheap insurance policy. By waiting, you’re increasing the likelihood that you’re buying into a rally, rather than the continuation of a correction.


