Use These To Find Your Stock’s Support and Resistance Levels
A stock is a trading and investing instrument representative of an underlying business but surprisingly gets too often misunderstood in a bear market.

This story originally appeared on MarketBeat
A stock is a trading and investing instrument representative of an underlying business. This sounds simple enough, but surprisingly gets too often misunderstood in a bear market. In other words, a stock is not the company. A business is an organization that operates on a day to day basis to pursue growth and profits for its shareholders. A stock is a three or four letter symbol that arguably represents the performance or expected performance of the underlying company. While this logic holds true in the long run, during shorter periods of time, a stock’s price can be completely decoupled with the company’s performance. This explains why blockbuster companies firing on all cylinders Pure Storage (NASDAQ: PSTG) beating earnings estimates and lifting guidance are trading down (-11%) or Lululemon (NASDAQ: LULU) down (-19%) or Abbott Labs (NYSE: ABT) are down (-21%) on the year. These solid companies are making records sales and profits, but you wouldn’t know it from their stock prices.
Market Climate Matters
A rising tide lifts all boats describes what happens to stocks in a rising bull market. The opposite also holds true as a volatile ocean sinks all boats in a falling bear market. Essentially, the same company performance in a bull market may have its shares trading at $50 while in its shares trade at $25 in a bear market. This is where the disconnect often happens between a company’s operations and its stock price. Therefore, it’s important to factor in the market climate background when analyzing your stock.
News is to Companies as Charts are to Stocks
There are two forms of research to performance analysis. The underlying company’s earnings, operating performance and news are analyzed as fundamental research. The company’s stock price is analyzed using charts as technical analysis. While we will cover the fundamental research in a future article, the technical analysis focuses solely on the stock’s price. This is tracked on a grid called a chart.
Candlestick Charts
Candlestick charts are one of the most widely used types of charts to properly analyze stock prices. A candlestick represents a single time period. For example, a single candlestick would represent one trading day on a daily chart. Each candlestick is formed using four pieces of information; the open, close, high, and low. The open is the price of the first trade on the 9:30am EST open of the day. The close is the price of the last trade recorded at the 4pm EST close. The high is the highest price shares traded during the day and the low is the lowest price the stock traded at during the day. These four piece of information are represented by the candlestick by plotting the open price and the closing price and connecting them and coloring the “body” green if the close is higher than the open and red if the close is lower than the open. The high and low are lines above and below the body called “wicks”.
Simple Moving Averages
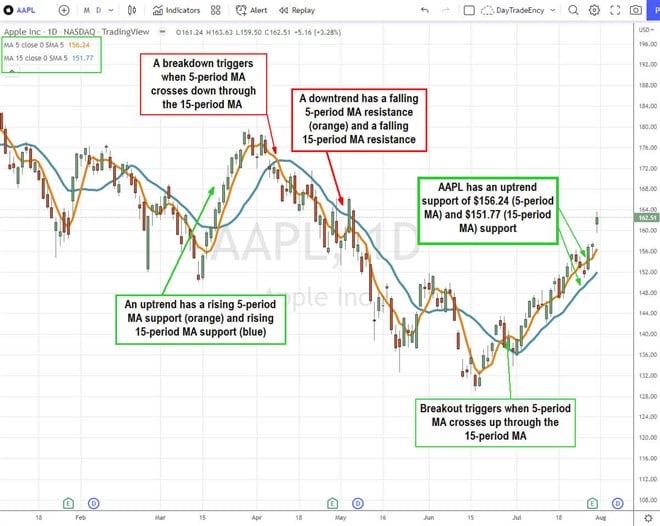
Every charting platform and online brokerage has these basic indicators called simple moving averages. A moving average is the running average of the number of specific periods on the time frame chart. For example, a daily 5-period simple moving average is the average price of 5 candlesticks, each representing a day of trading. Each of these plots are connected to form a moving average line on the chart. A 5-period simple moving average (MA) and a 15-period simple moving average are used together to form two moving average lines. The shorter time period which is the 5-period line is the lead moving average and the longer time period is the 15-period moving average. They both represent the support levels when a stock is uptrending, making higher highs and higher lows. They both represent the resistance when a stock is downtrending making lower lows and lower highs. The reason we use two moving average lines is not only to provide two levels of support and resistance, but to also determine a trend reversal when the 5-period MA crosses through the 15-period MA. When the 5-period MA crosses up through the 15-period MA, then a breakout triggers forming an uptrend. When the 5-period MA crosses down through the 15-period MA, then a breakdown triggers a downtrend. A charting program will give the real-time values for each moving average, which can then be used to determine support and resistance and to trade accordingly. Moving averages are dynamic as they are always updating with each candle close, whereas pivot points are static in that the values stay the same represented by horizontal lines. A trader or investor can opt to use either the lead 5-period MA or the laggard 15-period MA for trailing stops, or the crossover of the 5-period MA through the 15-period MA trend reversals to stop out of a position.
A stock is a trading and investing instrument representative of an underlying business. This sounds simple enough, but surprisingly gets too often misunderstood in a bear market. In other words, a stock is not the company. A business is an organization that operates on a day to day basis to pursue growth and profits for its shareholders. A stock is a three or four letter symbol that arguably represents the performance or expected performance of the underlying company. While this logic holds true in the long run, during shorter periods of time, a stock’s price can be completely decoupled with the company’s performance. This explains why blockbuster companies firing on all cylinders Pure Storage (NASDAQ: PSTG) beating earnings estimates and lifting guidance are trading down (-11%) or Lululemon (NASDAQ: LULU) down (-19%) or Abbott Labs (NYSE: ABT) are down (-21%) on the year. These solid companies are making records sales and profits, but you wouldn’t know it from their stock prices.
Market Climate Matters
A rising tide lifts all boats describes what happens to stocks in a rising bull market. The opposite also holds true as a volatile ocean sinks all boats in a falling bear market. Essentially, the same company performance in a bull market may have its shares trading at $50 while in its shares trade at $25 in a bear market. This is where the disconnect often happens between a company’s operations and its stock price. Therefore, it’s important to factor in the market climate background when analyzing your stock.
News is to Companies as Charts are to Stocks
There are two forms of research to performance analysis. The underlying company’s earnings, operating performance and news are analyzed as fundamental research. The company’s stock price is analyzed using charts as technical analysis. While we will cover the fundamental research in a future article, the technical analysis focuses solely on the stock’s price. This is tracked on a grid called a chart.


