The Complete Guide to Building a Metrics-Driven Company

Opinions expressed by Entrepreneur contributors are their own.
At nearly every kind of organization, the ability to communicate effective business metrics — both internally and externally — is among the most important capabilities that can be established. Good metrics can help you motivate your team, stay focused on key objectives, create realistic forecasts, impress investors and become acquirable by larger companies. The ability to create a strong metrics-driven culture is arguably one of the most critical skills for any new manager or CEO to possess.
The problem is that learning to think like a business-metrics analyst is really hard! It took me a few years to truly understand how to manage startup metrics as CEO of Brainscape, despite having nearly 10 previous years of experience in economics, finance and statistics. The existing litany of books and blog posts did not sufficiently prepare me for the “best practices” used in the world of business management analytics.
This column is my attempt to summarize my lessons learned while building a metrics-driven culture at Brainscape. I have been lucky enough to teach this curriculum in both a General Assembly class and as a mentor at the Kaplan/TechStars EdTech Accelerator, and now I am happy to share my startup metrics philosophy with the interwebs.
1. Start with a solid business model.
Much of the literature about growth metrics assumes that you are beginning with a series of key performance indicators (KPIs) that you already know you want to optimize. Want to improve retention? Just do a cohort analysis. Want to measure engagement? Simply calculate your daily active to monthly active user ratio. Want to boost monetization? Just fix your churn and your cart-abandonment rate. These metrics may indeed be important for some companies, yet every company is different. Looking at KPIs in a vacuum can risk losing the forest for the trees.
Related: Use the Metrics That Really Matter in Your Business
Rather than just starting with arbitrary metrics and tools such as Google Analytics or MixPanel, I recommend that every company begin its metrics-driven transformation by developing a complete business model dashboard. By this, I generally mean a shared Google spreadsheet(s) with a high-level multi-month performance summary, which allows all stakeholders to “dig down” and explore all the drivers that affect business growth. Starting with the structure of the model that you need helps keep you focused and will help you better target the data you need to actually collect.
Business models can generally be divided into two types: Revenue models, which help you understand all the components of your growth, and marketability models, which help you understand how profitably you can scale your business with paid-marketing activities.
Let’s look at each of these in more detail.
A. Revenue models
You can think of Revenue Models like a profit and loss statement on steroids. A good revenue model contains not only rows containing dollar values, but also rows containing contributors to revenue.
For example, if you have a jewelry store, you might have rows for:
- Number of store visitors
- Percent who engage with a salesperson
- Percent who make a purchase
- Average dollar amount spent per customer
All of those are drivers of revenue that your company’s stakeholders would want to know each month. Seeing your high-level revenue drivers in one place is a critical first step to becoming a metrics-driven company. The example spreadsheet shown here is only one way to break out your revenue contributors. There are many ways you could slice and dice a single business, and every company is itself unique. You need to pick the model that works best for your particular line of business.

Once you have determined the right way to break down your business into its highest-level drivers, you can keep digging down several more levels. The ecommerce website shown in this example spreadsheet might think of the world in terms of a formula such as this:
Revenue equals visitors times average revenue over visitor
For such a company, carefully breaking down sources of visitors is critical to understanding how it is performing from one month to the next.
The important thing is that you organize your model in the hierarchical format that makes the most sense for your particular business. If you do this, you will likely discover several places where you actually might not have the data available using your current tools (as illustrated in red above). We will take care of addressing these items in the second section.
B. Marketability models
If revenue models illustrate how businesses can optimize each part of their funnels, marketability models illustrate how businesses can scale by pouring new resources into the top of that funnel. Marketability models are a primary concern of venture capitalists when determining how fast and profitably you will be able to grow the business once they invest. At the crux of the marketability model is the ratio of the lifetime value of a customer to the cost of acquiring a customer, or LTV/CAC.
All paid-marketing activities should be viewed through this lens to determine if the unit economics are profitable before stepping on the gas.
LTV calculation: The LTV tends to be easier to calculate than the CAC. It is generally a product of the net revenue earned from a single paying customer throughout his or her entire time as a customer. In equation terms, you could say something like:
LTV equals [revenue divided by customer divided by month] times [average months as paying customer]
The structure of this equation may vary between subscription-based software companies, consulting firms and ecommerce websites, but the general idea is the same. LTV equals net revenue earned from the average paying customer, over all time. A subscription business with a monthly price of $10 and an average customer lifetime of 10-and-a-half months would have an LTV of $105.
CAC calculation: The CAC calculation tends to have many more forms than the LTV, since there is technically a different CAC for each marketing channel that a company employs. To oversimplify, a basic CAC calculation could be as follows:
CAC equals [cost to capture one prospect] divded by [percent of prospects who become buyers]
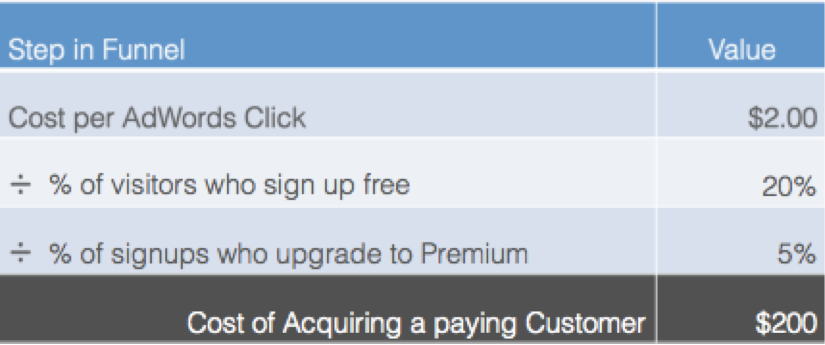
A typical CAC example is a Google AdWord campaign. In fact, this example is so typical that many early-stage startups use it as a “proxy” for paid marketing costs, when pitching venture capitalists before having actually begun actively marketing the product. This image is a simple version of this Google AdWords CAC calculation for a freemium business.
In other words, in this particular example, you need to spend $200 worth of Google Ads to be able to get one paying customer (unless you have a viral growth multiplier that can help you deflate your effective CAC). This example of a $200 CAC is a big number, so if that’s your company, you’d better hope that your LTV is significantly higher.
As a general rule of thumb, if you want to raise venture capital, you need to prove an LTV/CAC ratio of at least three to one (in addition to showing that there is a massive market). You need to show investors that you would be able to immediately magnify growth by boosting spending on proven marketing initiatives. Even if you just run a lifestyle business, continually optimizing for the LTV/CAC ratio will help you better market your product like the smart businessperson you are.
Every new company should build both of these types of models assuming they already have all the data available. But really, the data doesn’t matter at first. Build the right storytelling framework to demonstrate the viability of your business, and you can worry about collecting the actual data later.
Related: Why Your Startup Needs to Be Data Mature From the Beginning
2.Set up your data-collection tools.
Now that you have a solid framework with which to tell your company’s story with data, you can actually start finding the right tools to collect that data. This could involve a combination of web analytics (for example, Google Analytics or Kiss Metrics), mobile analytics (for example, Flurry), user surveys, financial data from Quickbooks, data exports from Salesforce.com, custom queries of your own database and any other number of tools that offer the data you need to complete your spreadsheet.

You may in fact need to consult one of your software developers to help you set up the proper integrations for collecting each data point. Collecting the right data can require quite a bit of work, so don’t underestimate this step.
The important thing is that you properly document the source of each individual data point, preferably within your central Google spreadsheet itself. This way, you will be able to more easily delegate your monthly data-collection responsibilities later. At Brainscape, to keep the spreadsheet “clean,” we consolidate the bulk of the data-collection instructions into a “note” attached to the respective cell. Our monthly data collector simply mouses over the respective cell and follows the directions for exactly how to collect each data point.
3. Define your monthly data-collection and communication processes.
Your new centralized business-model spreadsheet, with its proper data-collection procedure and clear instructions, can now serve as the basis for an ongoing data collection and communication process. You’ll just need to delegate and communicate the right messages.
A. Find a data collection assistant.
Assuming that your business has a significant number of data points that aggregate up to your overall story, you will probably want to delegate the collection responsibilities to a more junior employee or virtual assistant. Brainscape’s model, for instance, has more than 300 “feeder” stats that represent several intricate elements of our user-experience funnels. I would rather not do all that data entry myself!
If your junior employees are not right for the task (or if such a “repetitive” task is not the best use of their time), then you might want to consider hiring a virtual assistant. Freelancers from services such as UpWork can be perfect for such projects and can even, over time, evolve into a multi-year employee at your company.
B. Sufficiently train your collectors.
No matter how good your initial data-collection instructions, there’s bound to be a few confusing stats once the data starts rolling in. Be sure to work closely with your data collector and allow him or her to ask plenty of questions, until you feel that they are 100 percent self-sufficient in collecting your data correctly.
C. Establish a collection schedule.
For most companies, it’s most practical to aggregate all business model data on a monthly basis. Of course, there will always be cases in which you need to analyze data on a shorter time frame — like when you are evaluating results of an experiment or testing the effect of a new software release — but for those cases you can always perform an ad hocanalysis using a temporary spreadsheet. The main record of your KPIs will likely be the one that will align with your P&Ls and other monthly reporting tools.
Whatever your data-aggregation frequency, you should set up a recurring calendar reminder for both yourself and for your data collector(s), on the day that the previous period’s data becomes available. This will help remind you to check the results so that you can begin the process of communicating your reports to stakeholders.
D. Extrapolate forecasts and “what if” scenarios.
Having a well-organized model of your business’s growth drivers is not only helpful for evaluating what already happened, it is also critical for forecasting what will happen. I recommend drawing a vertical line down your spreadsheet to divide the months that are actuals (past) from the months that are forecast (future). (I even have my forecast months’ data in light gray text to help distinguish it from the actuals.) Then you can adjust the formulas in the forecast columns to ensure that your conversion rates are appropriately tied to growth.
To help use your spreadsheets as a conversation tool, I’ve also found it helpful to highlight your key “assumption” cells with a yellow background. This basically tells the viewer, “Tweak me to see what happens to the rest of the forecast.” For example, if you want to illustrate the potential effects of improving retention or signup-conversion rates by 1 percent, simply tweak the yellow assumption cells and watch the forecast adjust itself.
Here is an example of a model spreadsheet. Be sure to review both the main tab and the detailed tab.
E. Communicate results with relevant stakeholders.
One of the best features of Google Spreadsheets is the ability to set custom permissions for specific viewers. Perhaps you only want the document to be edited by you and your data-entry assistant, but you want your investors to be able to view the data, and you want to ensure that your board of directors can comment. The flexibility of Google Spreadsheets makes it easy for you to use the exact same document for many types of communications.
For most companies, I recommend sharing results with your entire team (and soliciting comments) as soon as the updated data is ready each month. Get explanations for any big movers on the spreadsheet. Then, once you feel you have a comfortable understanding of what happened this month, share the spreadsheet with your board of directors (or immediate management team) and encourage them to add comments to any cell that they still have questions about. Starting by “virtually” discussing KPIs makes it easier to subsequently discuss them verbally in a metrics meeting.
For the rest of your investors (or potential investors), you can use your discretion regarding whether you want to share the complete business-model spreadsheet with them. If you are particularly transparent, then you can share the entire spreadsheet with them (with view permissions only), but you may also just want to share a “master” high-level spreadsheet that you might paste into a different standalone file.
In general, the goal of your data-collection and communication process should be to make it so “automated” that you don’t even have to think about it each month. Building stories with data can be exhausting, so the more fully you can get the data-collection and communication tasks off your plate (or into a no-brainer monthly calendar reminder), the more mental resources you will have available to analyze your data.
4. Analyze and act on your data.
Monthly team data discussions are typically full of insightful talking points. Is the market really as big as we thought? Is one demographic using our product more frequently than others? Are we really losing that many customers because of that one single web page? Having a transparent, tweakable business-model spreadsheet makes such discussions as productive and actionable as possible.
The type of corrective action required to act on a single metric deficiency (or opportunity) naturally varies depending on the metric in question. Improving a specific KPI may require focus groups, A/B tests, email blasts, mobile push notifications, new product features or more targeted marketing-campaign spending. Prioritizing your KPIs and determining the right corrective actions is a management skill that comes with experience.
5. Constantly iterate on your model.
Earlier in this guide I mentioned that the goal of your data-collection process was to make it so automated that you no longer have to think about it. That was kind of a lie. While you certainly do want to modularize and delegate data-collection responsibilities, the reality is that the business model’s structure itself may constantly change as your business activities evolve.
Every new feature or business line may necessitate a change to your central spreadsheet and a revision of your data-collector training materials. Updating your spreadsheet every time you update your product or marketing can help you from falling behind in your understanding of your business itself.
Becoming a truly metrics-driven company requires you to constantly strive for a state of metrics automation that you will never permanently achieve. In his famous book, Predictable Success, Les McKeown advises business leaders to relentlessly challenge the status quo while maintaining a formal, regular process for informed decision-making. Such a level of predictable success is impossible to reach if you have not first instilled a metrics-driven culture in your company’s DNA.
Related: 4 Metrics Enterprise Software Companies Should Be Tracking, But Aren’t
At nearly every kind of organization, the ability to communicate effective business metrics — both internally and externally — is among the most important capabilities that can be established. Good metrics can help you motivate your team, stay focused on key objectives, create realistic forecasts, impress investors and become acquirable by larger companies. The ability to create a strong metrics-driven culture is arguably one of the most critical skills for any new manager or CEO to possess.
The problem is that learning to think like a business-metrics analyst is really hard! It took me a few years to truly understand how to manage startup metrics as CEO of Brainscape, despite having nearly 10 previous years of experience in economics, finance and statistics. The existing litany of books and blog posts did not sufficiently prepare me for the “best practices” used in the world of business management analytics.
This column is my attempt to summarize my lessons learned while building a metrics-driven culture at Brainscape. I have been lucky enough to teach this curriculum in both a General Assembly class and as a mentor at the Kaplan/TechStars EdTech Accelerator, and now I am happy to share my startup metrics philosophy with the interwebs.


